In Unix computing, the system load is a measure of the amount of work that a computer system performs.
The most common tools are uptime, procinfo, w(ho), top. among which top covers pretty much. so lets stick to top
$top
As you can see
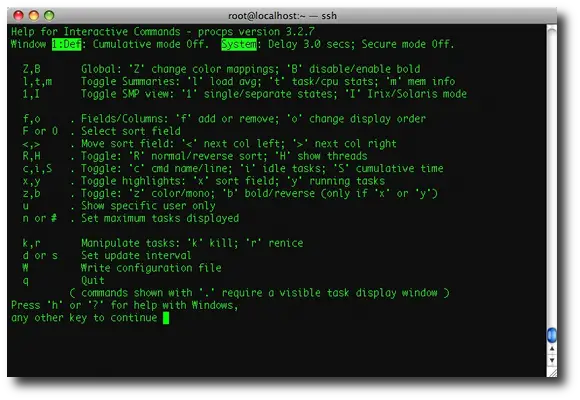
The above Fig shows the different options along with top. Consider that there are two basic modes to display load : "IRIX mode" and "Solaris mode". In IRIX mode (Linux default), a load average of 1 means that one CPU is fully loaded ( or 25% of each CPU on a 4 CPU system, etc). In Solaris mode, a load average of 1 means that all CPUs are fully loaded (so it's actually equivalent to "IRIX mode" load divided by CPU count ).
Note that the "Cpu(s)" line in the header of the output shows the percentage usage across all of the available CPUs, whereas the %CPU column represents the percentage usage of a single CPU. For example, on a four-CPU machine the Cpu(s) row will total 100% and the %CPU column will total 400%. We can view each Cpus load separately by toggling '1'
Lets Get Down Deep
Now let’s go inside the Linux kernel and see what it is doing to generate these load average numbers.
unsigned long avenrun[3];
static inline void calc_load(unsigned long ticks)
{
unsigned long active_tasks; /* fixed-point */
628
static int count = LOAD_FREQ;
count -= ticks;
if (count > 0) {
count += LOAD_FREQ;
active_tasks = count_active_tasks( );
CALC_LOAD(avenrun[0], EXP_1, active_tasks);
CALC_LOAD(avenrun[1], EXP_5, active_tasks);
CALC_LOAD(avenrun[2], EXP_15, active_tasks);
}
}
The countdown is over a LOAD_FREQ of 5 HZ. How often is that?
1 HZ = 100 ticks
5 HZ = 500 ticks
1 tick = 10 milliseconds
500 ticks = 5000 milliseconds (or 5 seconds)
So, 5 HZ means that CALC_LOAD is called every 5 seconds.
Magic NumbersThe function CALC_LOAD is a macro defined in sched.h
extern unsigned long avenrun[]; /* Load averages */
#define FSHIFT 11 /* nr of bits of precision */
#define FIXED_1 (1<
#define LOAD_FREQ (5*HZ) /* 5 sec intervals */
#define EXP_1 1884 /* 1/exp(5sec/1min) as fixed-point */
#define EXP_5 2014 /* 1/exp(5sec/5min) */
#define EXP_15 2037 /* 1/exp(5sec/15min) */
#define CALC_LOAD(load,exp,n) \
load *= exp; \
load += n*(FIXED_1-exp); \
load >>= FSHIFT;
A noteable curiosity is the appearance of those magic numbers: 1884, 2014, 2037. What do they mean? If we look at the preamble to the code we learn,
/*
* These are the constant used to fake the fixed-point load-average
* counting. Some notes:
* - 11 bit fractions expand to 22 bits by the multiplies: this gives
* a load-average precision of 10 bits integer + 11 bits fractional
* - if you want to count load-averages more often, you need more
* precision, or rounding will get you. With 2-second counting freq,
* the EXP_n values would be 1981, 2034 and 2043 if still using only
* 11 bit fractions.
*/
These magic numbers are a result of using a fixed-point (rather than a floating-point) representation. For more information 4th Chapter , Neil J. Gunther. "UNIX Load Average – Part 1: How It Works" (pdf). TeamQuest. http://www.teamquest.com/pdfs/whitepaper/ldavg1.pdf. Retrieved 2009-08-12.
so now its clear that the problems with this are
The most common tools are uptime, procinfo, w(ho), top. among which top covers pretty much. so lets stick to top
$top
As you can see
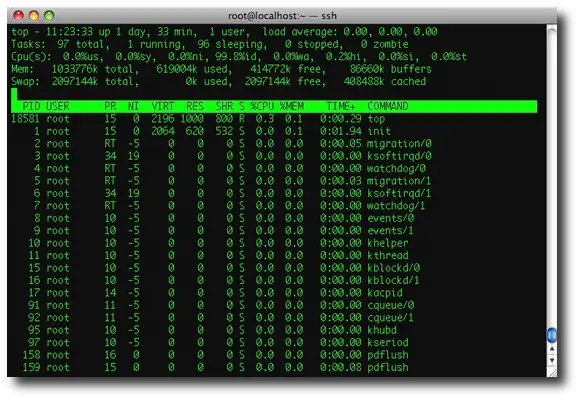
- Line 1 “top”, indicates that the system has been up and running for 171 days.
- Line 2 “Tasks”, displays the total number of processes along with a breakdown of running, sleeping, stopped and zombie processes count.
- it takes values from /proc/stat.
- the first /proc/stat line shows like this at t0
cpu user nice system idle iowait irq softirq (dont know)
cpu 736324 49874 581102 298162832 3012015 120311 0 0
a few seconds later (t1):
cpu 736334 49874 581102 298162971 3012015 120311 0 0
differences:
cpu 10 0 0 139 0 0 0 0
all numbers together at t0 are: 302662458
a few seconds later (t1): 302662607
difference (t1-t0): 149
the difference 149 is 100% cpu time
so it seems the cpu has spent 93.28% (139 time unit's (seems to be USER_HZ)) in cpu idle
and 6.72% in user mode
for more detailed description see: http://www.linuxhowtos.org/System/procstat.htm
as the link describes the values in /proc/stat identify the amount of time the cpu has spent in what kind of "work"
- Line 3 “Cpu(s)” displays the current CPU utilization of the system. In this example, CPU is 98.7% idle
- here the meaning of each
- us -> User CPU time: The time the CPU has spent running users’ processes that are not niced.
- sy -> System CPU time: The time the CPU has spent running the kernel and its processes.
- ni -> Nice CPU time: The time the CPU has spent running users’ proccess that have been niced.
- wa -> iowait: Amount of time the CPU has been waiting for I/O to complete.
- hi -> Hardware IRQ: The amount of time the CPU has been servicing hardware interrupts.
- si -> Software Interrupts.: The amount of time the CPU has been servicing software interrupts.
- st -> Time stolen from a virtual machine.
- Line 4 “Mem” and line 5 “Swap” provides the memory information. This is the same information from the free command.
- The rest of the lines display all the active processes on the
system, sorted default by CPU usage (%CPU column). i.e the most CPU
intensive processes will be displayed on the top by default. PID - The thread ID. This can be converted into hexadecimal and used to correlate to the "native ID" in a javacore.txt file.
USER - The user ID of the user that started the process.
PR - The priority of the thread.
NI - The "nice" value for the process.
VIRT - The virtual memory (allocated) usage of the process.
RES - The resident memory (committed) usage of the process.
SHR - The shared memory usage of the process.
S - The state of the thread. This can be one of the following:- R - Running
- S - Sleeping
- D - Uninterruptible sleep
- T - Traced
- Z - Zombie
%MEM - The percentage of the memory used by the process.
TIME+ - The amount of CPU time used by the thread.
COMMAND - The name of the process executable.
 top - 16:15:45 up 21 days,  2:27,  3 users,  load   average: 17.94, 12.30, 5.52
  Tasks: 150 total,  26 running, 124 sleeping,   0   stopped,   0 zombie
  Cpu(s): 87.3% us,  1.2% sy,  0.0% ni, 27.6% id,  0.0%   wa,  0.0% hi,  0.0% si
  Mem:   4039848k total,  3999776k used,   40072k free,    92824k buffers
  Swap:  2097144k total,      224k used, 2096920k free,  1131652k cached
  PID USER    PR  NI  VIRT  RES  SHR S %CPU   %MEM    TIME+  COMMAND
  31253 user1   16   0 2112m 2.1g 1764 R 37.0   53.2   0:39.89 java
  31249 user1   16   0 2112m 2.1g 1764 R 15.5   53.2   0:38.29 java
  31244 user1   16   0 2112m 2.1g 1764 R 13.6   53.2   0:40.05 java
  31250 user1   16   0 2112m 2.1g 1764 R 13.6   53.2   0:41.23 java
  31242 user1   16   0 2112m 2.1g 1764 R 12.9   53.2   0:40.56 java
  31238 user1   16   0 2112m 2.1g 1764 S 12.6   53.2   1:22.21 java
  31246 user1   16   0 2112m 2.1g 1764 R 12.6   53.2   0:39.62 java
  31248 user1   16   0 2112m 2.1g 1764 R 12.6   53.2   0:39.40 java
  31258 user1   16   0 2112m 2.1g 1764 R 12.6   53.2   0:39.98 java
  31264 user1   17   0 2112m 2.1g 1764 R 12.6   53.2   0:39.54 java
  31243 user1   16   0 2112m 2.1g 1764 R 12.2   53.2   0:37.43 java
  31245 user1   16   0 2112m 2.1g 1764 R 12.2   53.2   0:37.53 java
  31255 user1   16   0 2112m 2.1g 1764 R 11.9   53.2   0:40.84 java
  31265 user1   16   0 2112m 2.1g 1764 R 11.9   53.2   0:40.46 java
  31239 user1   16   0 2112m 2.1g 1764 S 11.6   53.2   1:22.79 java
  31254 user1   16   0 2112m 2.1g 1764 R 11.6   53.2   0:41.12 java
  31266 user1   16   0 2112m 2.1g 1764 R 11.2   53.2   0:40.47 java
  31261 user1   16   0 2112m 2.1g 1764 R 10.9   53.2   0:39.31 java
  31262 user1   16   0 2112m 2.1g 1764 R 10.9   53.2   0:38.50 java
In the per-thread breakdown of the CPU usage shown above, the java process is taking approximately 75% of the CPU usage. This value is found by totalling the %CPU column for all the Java threads (not all threads are shown above) and dividing by the number of CPUs. The Java process is not limited by other processes, because the CPU there is still approximately 25% idle. You can also see that the CPU usage of the Java process is spread reasonably evenly over all of the threads in the Java process. This spread implies that no one thread has a particular problem. Although the application is allowed to use most of the available CPU, approximately 25% of the total CPU is idle meaning that some points of contention or delay in the Java process can be identified. A report indicating that active processes are using a small percentage of CPU, even though the machine appears idle, means that the performance of the application is probably limited by points of contention or process delay, preventing the application from scaling to use all of the available CPU. If a deadlock is present, the reported CPU usage for the Java process is low or zero. If threads are looping, the Java CPU usage approaches 100%, but a small number of the threads account for all of that CPU time.- Line 1 also has load average details. The load average represents the average system load over a period of time. The system load measures the amount of work your system performs. On *x Systems you usually get the 3 numbers representing the average load during the last 1, 5 and 15 minutes. You can also query the current values from the shell with many tools including uptime, w and top. On Linux Systems you can also read /proc/loadavg. The Value itself starts with 0 for an idle computer. Each process using or waiting for CPU increments the load number by 1. Depending on the number of CPUs you can estimate the system usage in percent. With one CPU a load average of 1 means 100% CPU "usage" and a load average of 1.86 means the CPU is overloaded by 86 percent. Just divide by the number of CPUs available to get your percentage. The Load shouldnt exceed the number of CPU's in your system. Technically the load average is the sum of the run queue length and the number of jobs currently running on the CPUs. The load average tries to measure the number of active processes at any time. As a measure of CPU utilization, the load average is simplistic, poorly defined, but far from useless.
The above Fig shows the different options along with top. Consider that there are two basic modes to display load : "IRIX mode" and "Solaris mode". In IRIX mode (Linux default), a load average of 1 means that one CPU is fully loaded ( or 25% of each CPU on a 4 CPU system, etc). In Solaris mode, a load average of 1 means that all CPUs are fully loaded (so it's actually equivalent to "IRIX mode" load divided by CPU count ).
Note that the "Cpu(s)" line in the header of the output shows the percentage usage across all of the available CPUs, whereas the %CPU column represents the percentage usage of a single CPU. For example, on a four-CPU machine the Cpu(s) row will total 100% and the %CPU column will total 400%. We can view each Cpus load separately by toggling '1'
Lets Get Down Deep
Now let’s go inside the Linux kernel and see what it is doing to generate these load average numbers.
unsigned long avenrun[3];
static inline void calc_load(unsigned long ticks)
{
unsigned long active_tasks; /* fixed-point */
628
static int count = LOAD_FREQ;
count -= ticks;
if (count > 0) {
count += LOAD_FREQ;
active_tasks = count_active_tasks( );
CALC_LOAD(avenrun[0], EXP_1, active_tasks);
CALC_LOAD(avenrun[1], EXP_5, active_tasks);
CALC_LOAD(avenrun[2], EXP_15, active_tasks);
}
}
The countdown is over a LOAD_FREQ of 5 HZ. How often is that?
1 HZ = 100 ticks
5 HZ = 500 ticks
1 tick = 10 milliseconds
500 ticks = 5000 milliseconds (or 5 seconds)
So, 5 HZ means that CALC_LOAD is called every 5 seconds.
Magic NumbersThe function CALC_LOAD is a macro defined in sched.h
extern unsigned long avenrun[]; /* Load averages */
#define FSHIFT 11 /* nr of bits of precision */
#define FIXED_1 (1<
#define LOAD_FREQ (5*HZ) /* 5 sec intervals */
#define EXP_1 1884 /* 1/exp(5sec/1min) as fixed-point */
#define EXP_5 2014 /* 1/exp(5sec/5min) */
#define EXP_15 2037 /* 1/exp(5sec/15min) */
#define CALC_LOAD(load,exp,n) \
load *= exp; \
load += n*(FIXED_1-exp); \
load >>= FSHIFT;
A noteable curiosity is the appearance of those magic numbers: 1884, 2014, 2037. What do they mean? If we look at the preamble to the code we learn,
/*
* These are the constant used to fake the fixed-point load-average
* counting. Some notes:
* - 11 bit fractions expand to 22 bits by the multiplies: this gives
* a load-average precision of 10 bits integer + 11 bits fractional
* - if you want to count load-averages more often, you need more
* precision, or rounding will get you. With 2-second counting freq,
* the EXP_n values would be 1981, 2034 and 2043 if still using only
* 11 bit fractions.
*/
These magic numbers are a result of using a fixed-point (rather than a floating-point) representation. For more information 4th Chapter , Neil J. Gunther. "UNIX Load Average – Part 1: How It Works" (pdf). TeamQuest. http://www.teamquest.com/pdfs/whitepaper/ldavg1.pdf. Retrieved 2009-08-12.
so now its clear that the problems with this are
- The “load” is not the utilization but the total queue length.
- They are point samples of three different time series.
- They are exponentially-damped moving averages.
- They are in the wrong order to represent trend information.